Last year, I signed up for Matthew Berry’s RotoPass. Between a 1-year subscription to ESPN Insider and a bunch of other content, I thought there was nothing to lose. With that subscription I was introduced to MyFantasyLeague.com and their addicting MFL10 format.
The MFL10 is a non-managed “best ball” league, meaning you do not have to worry about setting lineups. The caveat is once you finish drafting, there are no adds, drops, trades, or any other management whatsoever. Just wait and see how many points you accumulate.
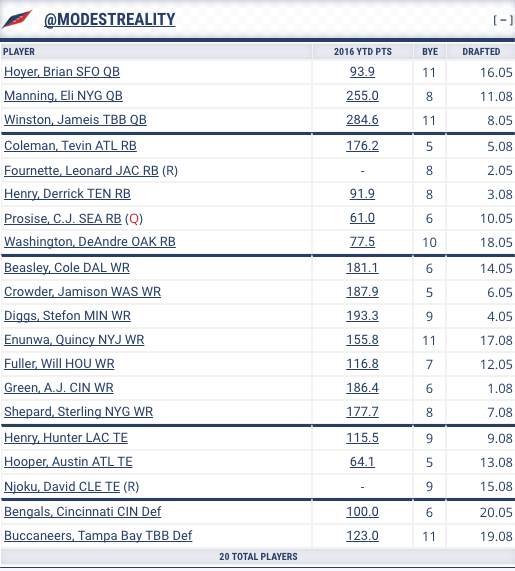
MFL10 leagues have 12-teams, each with a 20-person roster. This provides plenty of cushion for players that bust during the season. Roster construction is QB/WR/WR/WR/RB/RB/TE/FLEX/DEF with PPR scoring. First place wins $100, second win’s a free entry, and everyone else goes home.
This year, I am getting an early start and have completed my first two MFL10 contests. The first was entered after the 2017 after the NFL draft concluded, and the second about a week and a half later.
Strategy for the first MFL10 was to go by “gut” feel and draft the players I liked. Average draft position was generally ignored as it was expected that ADPs were all going to change once rookie landing spots were digested. These decisions also took into account opinions from various podcasts, articles, and daily chat on Twitter. Overall, I plan to use this MFL10 as a benchmark as the offseason develops.
Strategy for the second MFL10 was to use a value based approach, and target a specific position for each of the 20 rounds. Drafting decisions were made using average draft position data from the Rotoviz Best Ball and MFL10 ADP App, between 4/30/17 (day after the NFL draft) and 5/10/17 (day this particular MFL10 commenced). My approach was to choose the best player available in the targeted position, regardless of how I personally felt about the player.
The strategy generally worked well, outside of selecting Aaron Rodgers at the 4.04 position. This was due to a discrepancy between how I expected the site to work and its actual functionality — and I adjusted for this going forward. I also made certain concessions such as skipping injured and suspended players, passing on multiple players at the same position on one NFL team, and avoided selecting too many rookies.

During the draft process, each pick was evaluated based off the following formula:
(Overall Draft Position – RotoViz Average Draft Position) / Standard Deviation
This created a percentage with an expected scale of -100% (earliest in the range this player typically is drafted) to 100% (latest in the range this player is typically drafted). Players with a percentage lower than -100% was an over reach, and players with a percentage greater than 100% provided better than expected value.

Overall, 30% of picks generated better than expected value and 95% of picks fell on the positive size of the draft range.